Intellectual Property rights protection in Ethiopia #2
The two topics at the agenda were (i) improving the allocation of forex and (ii) better immigration procedures. Following initial recommendations made by the business communities in June 2017, both Immigration and NBE came prepared to the meeting offering concrete solutions and commitments. EIC and the business communities also agreed on the steps forward in order to keep this Public-Private Dialogue productive and sustainable.
European Business Organisation Worldwide Network (EBOWWN)'s Annual General Assembly
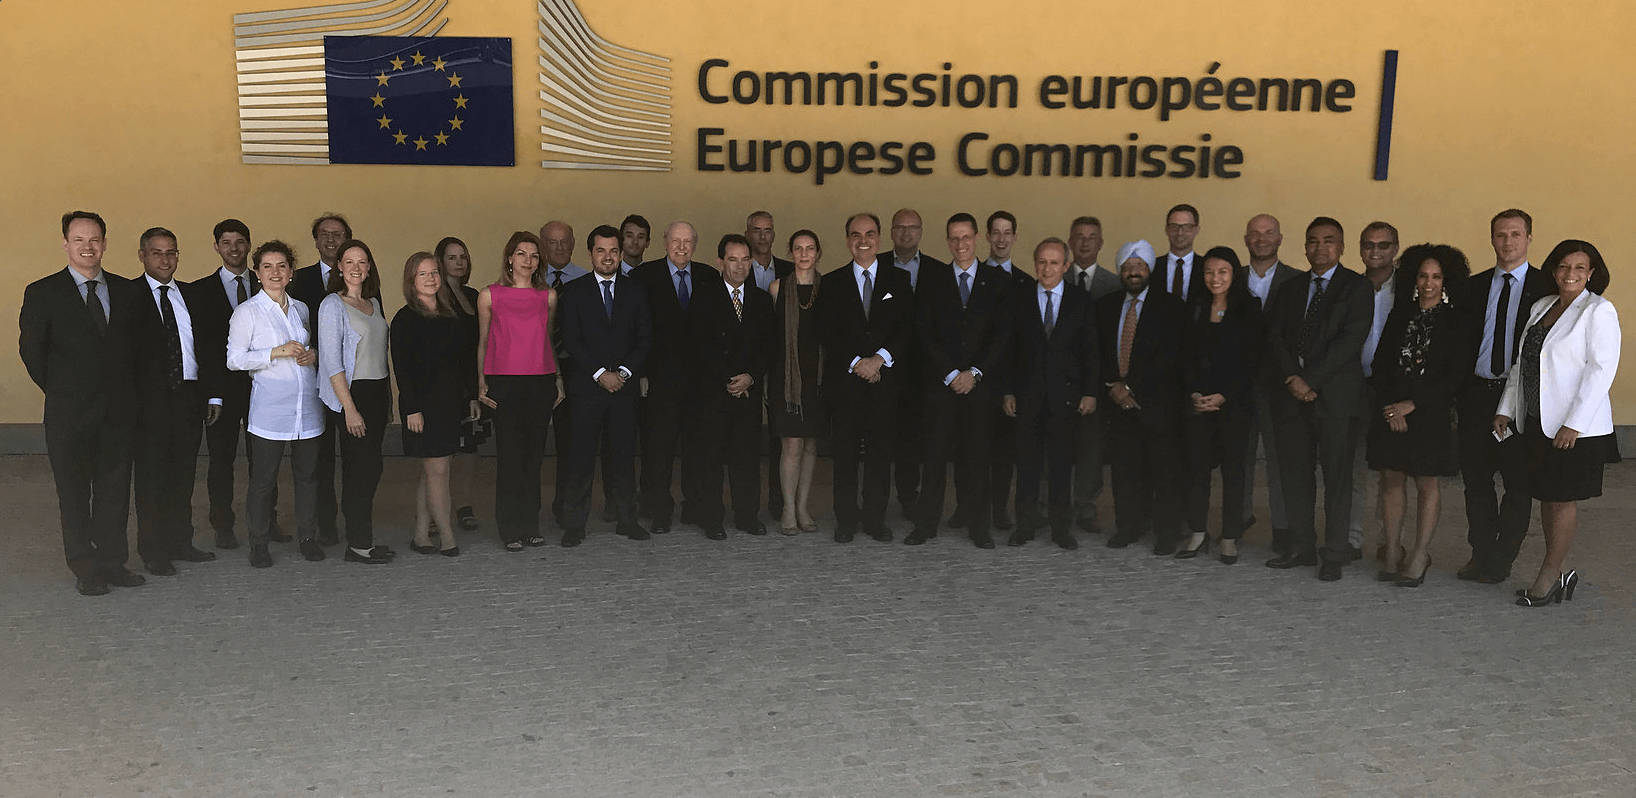
The EUBFE participated from June 19 to June 21 to EBOWWN’s AGM where its application to become a member of the organisation was accepted. By joining EBOWWN, the EUBFE will benefit from best practices sharing, will establish itself as the official representative of the EU business community in Ethiopia and will be able to raise important issues faced by EU businesses in developing countries. More information on EBOWWN can be found on its website (wwww.ebowwn.eu)
EUBFE 1st Thematic Breakfast
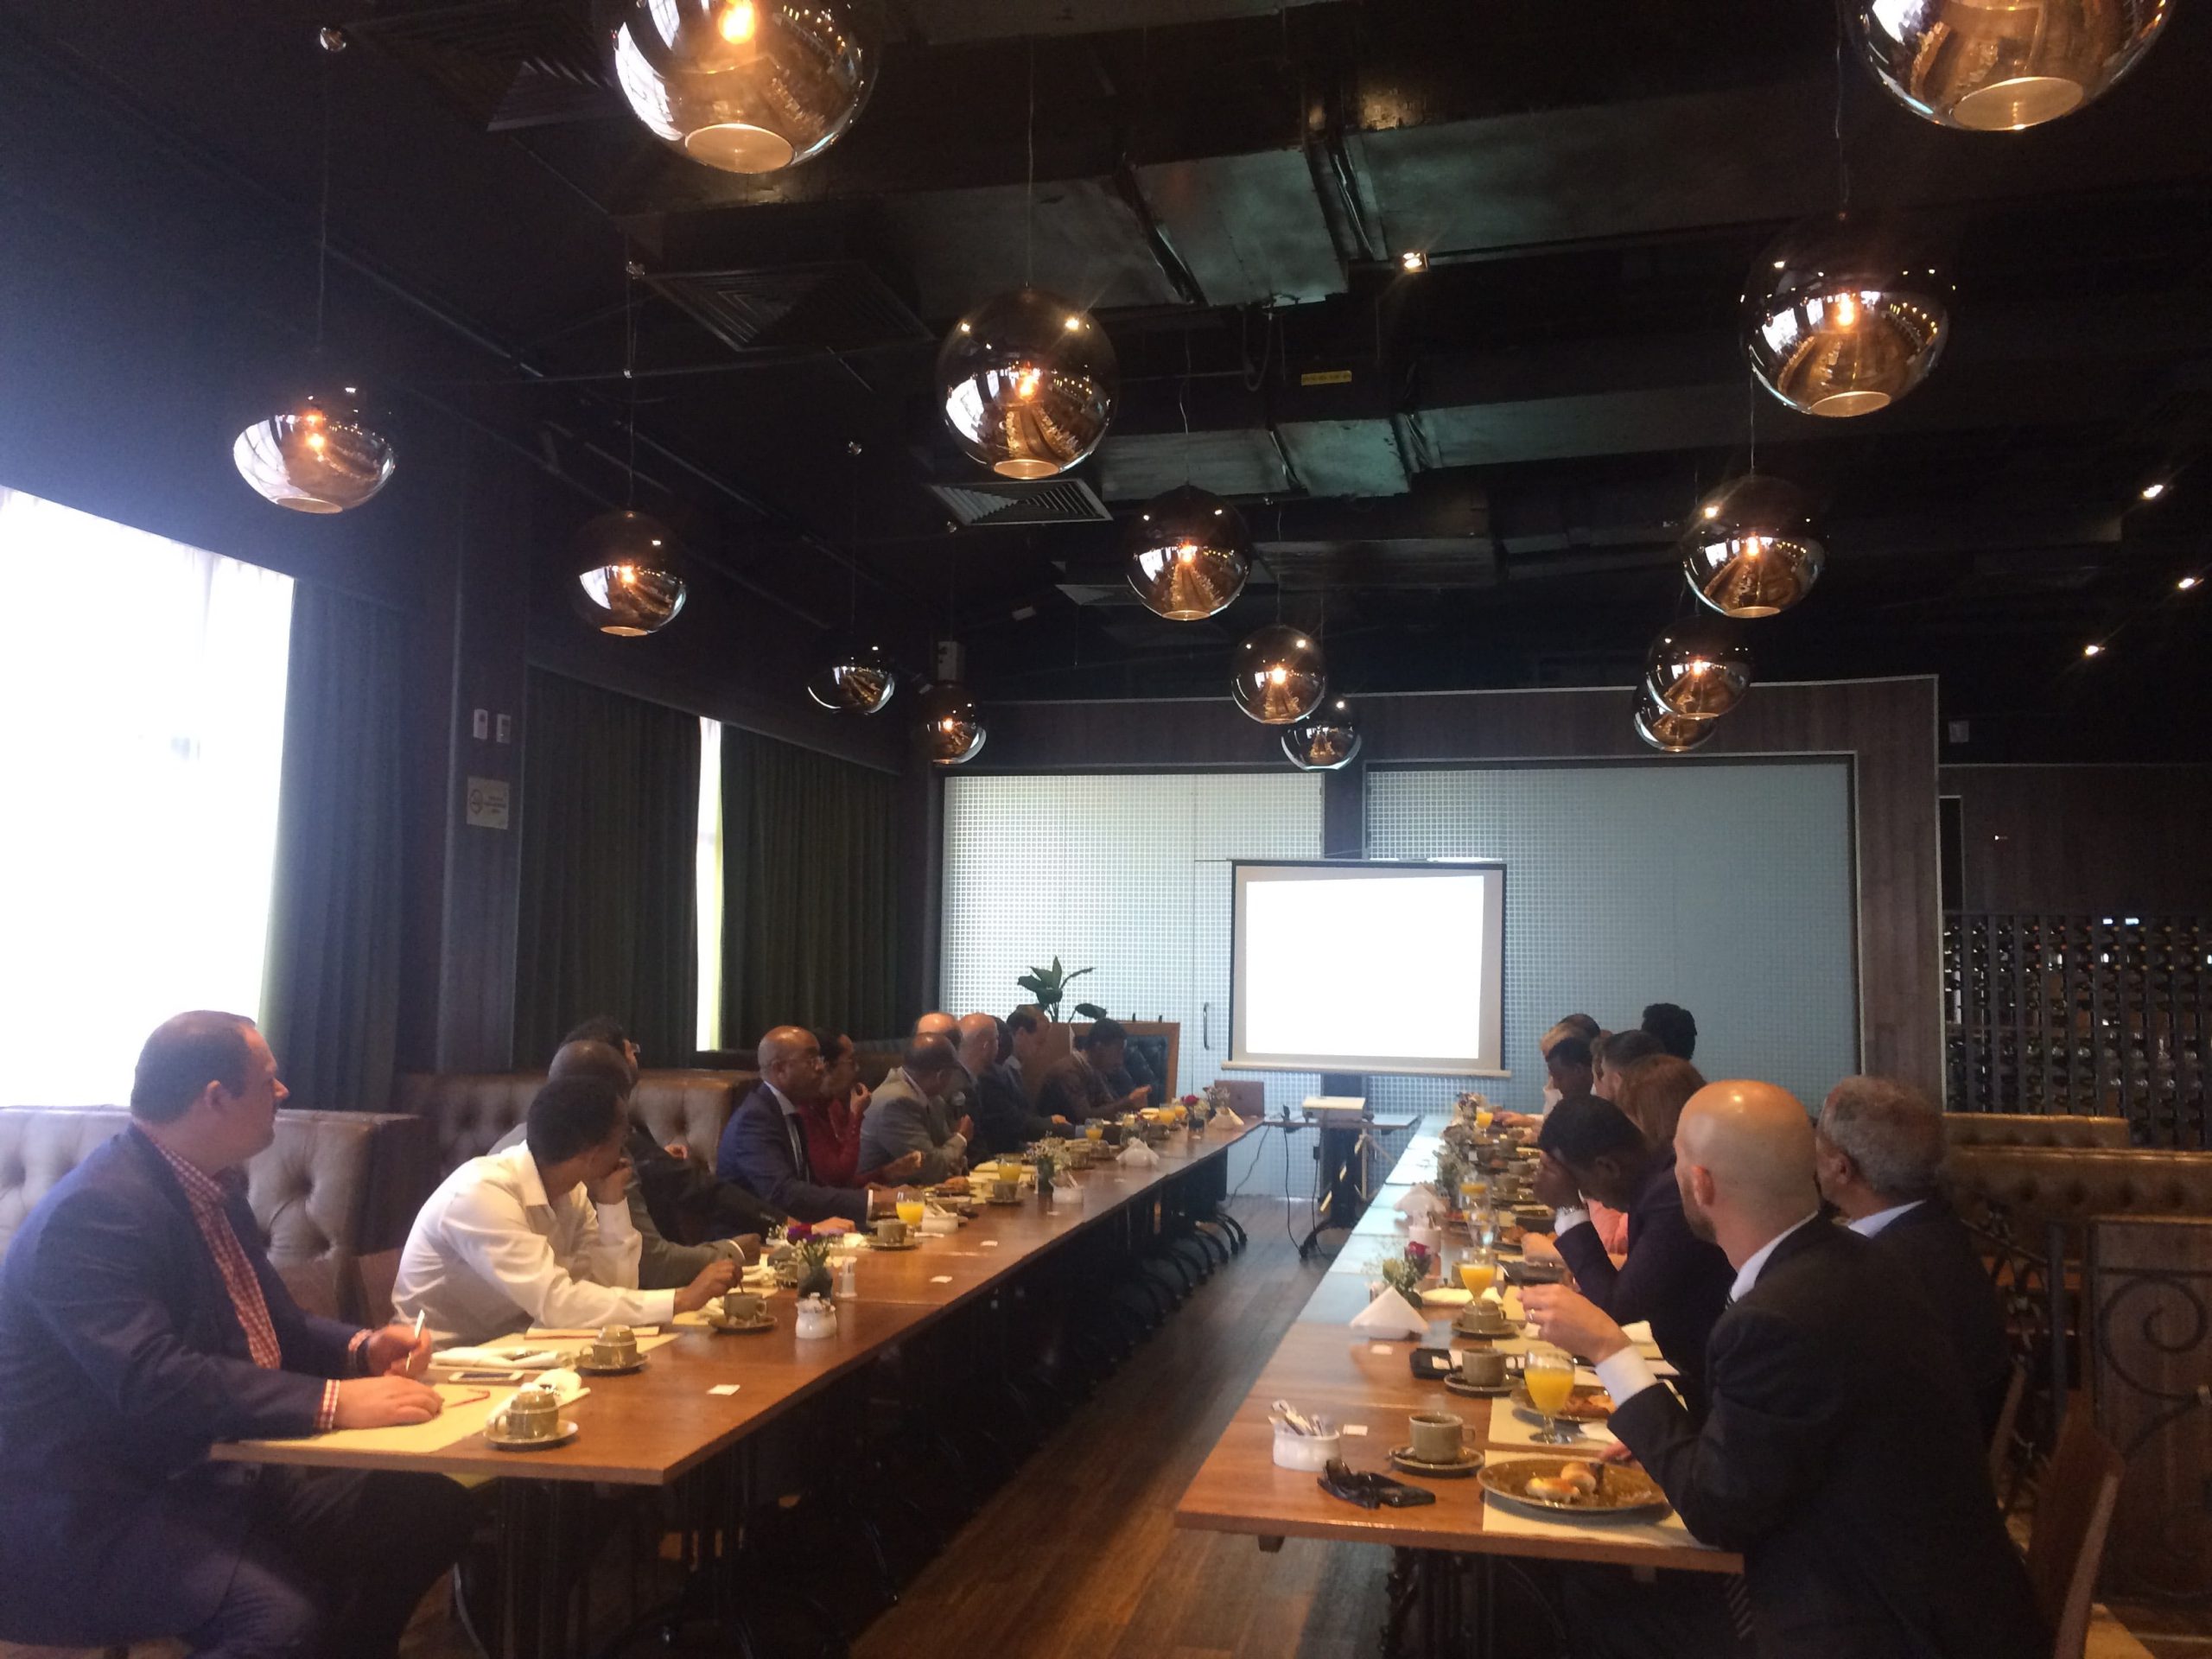
On June 14th, 2017, the EUBFE held its first Thematic Breakfast, at the Ramada Addis. The Guest Speaker, H.E Dr. Yohannes Ayalew – Chief Economist and Vice Governor of Monetary Stability at the National Bank of Ethiopia (NBE) presented the view of the NBE on FOREX, notably regarding: (i) current conditions; (ii) considered solutions by the NBE to improve the situation; and (iii) forecast for the short to medium-term. A lively Q&A session followed.
EUBFE Official Launching
On March 29th, 2017, the European Union Business Forum in Ethiopia (EUBFE) celebrated its official launching, following its formal registration as ‘Foreign Investors Association’ under Ethiopian law. The registration shall facilitate the work towards achieving EUBFE’s main mission: to improve the business environment in Ethiopia in order to enhance commercial and economic ties between the EU and Ethiopia.

New Memorandum of Understanding with ERCA
In December 2016, the EUBFE signed a new Memorandum of Understanding (MoU) with ERCA in order to facilitate information-sharing and to provide a channel for the EU business community to raise its issues and to express its remarks and questions. The new MoU notably set-up a Steering Committee in charge of ensuring the effectiveness of the MoU and to facilitate discussions.
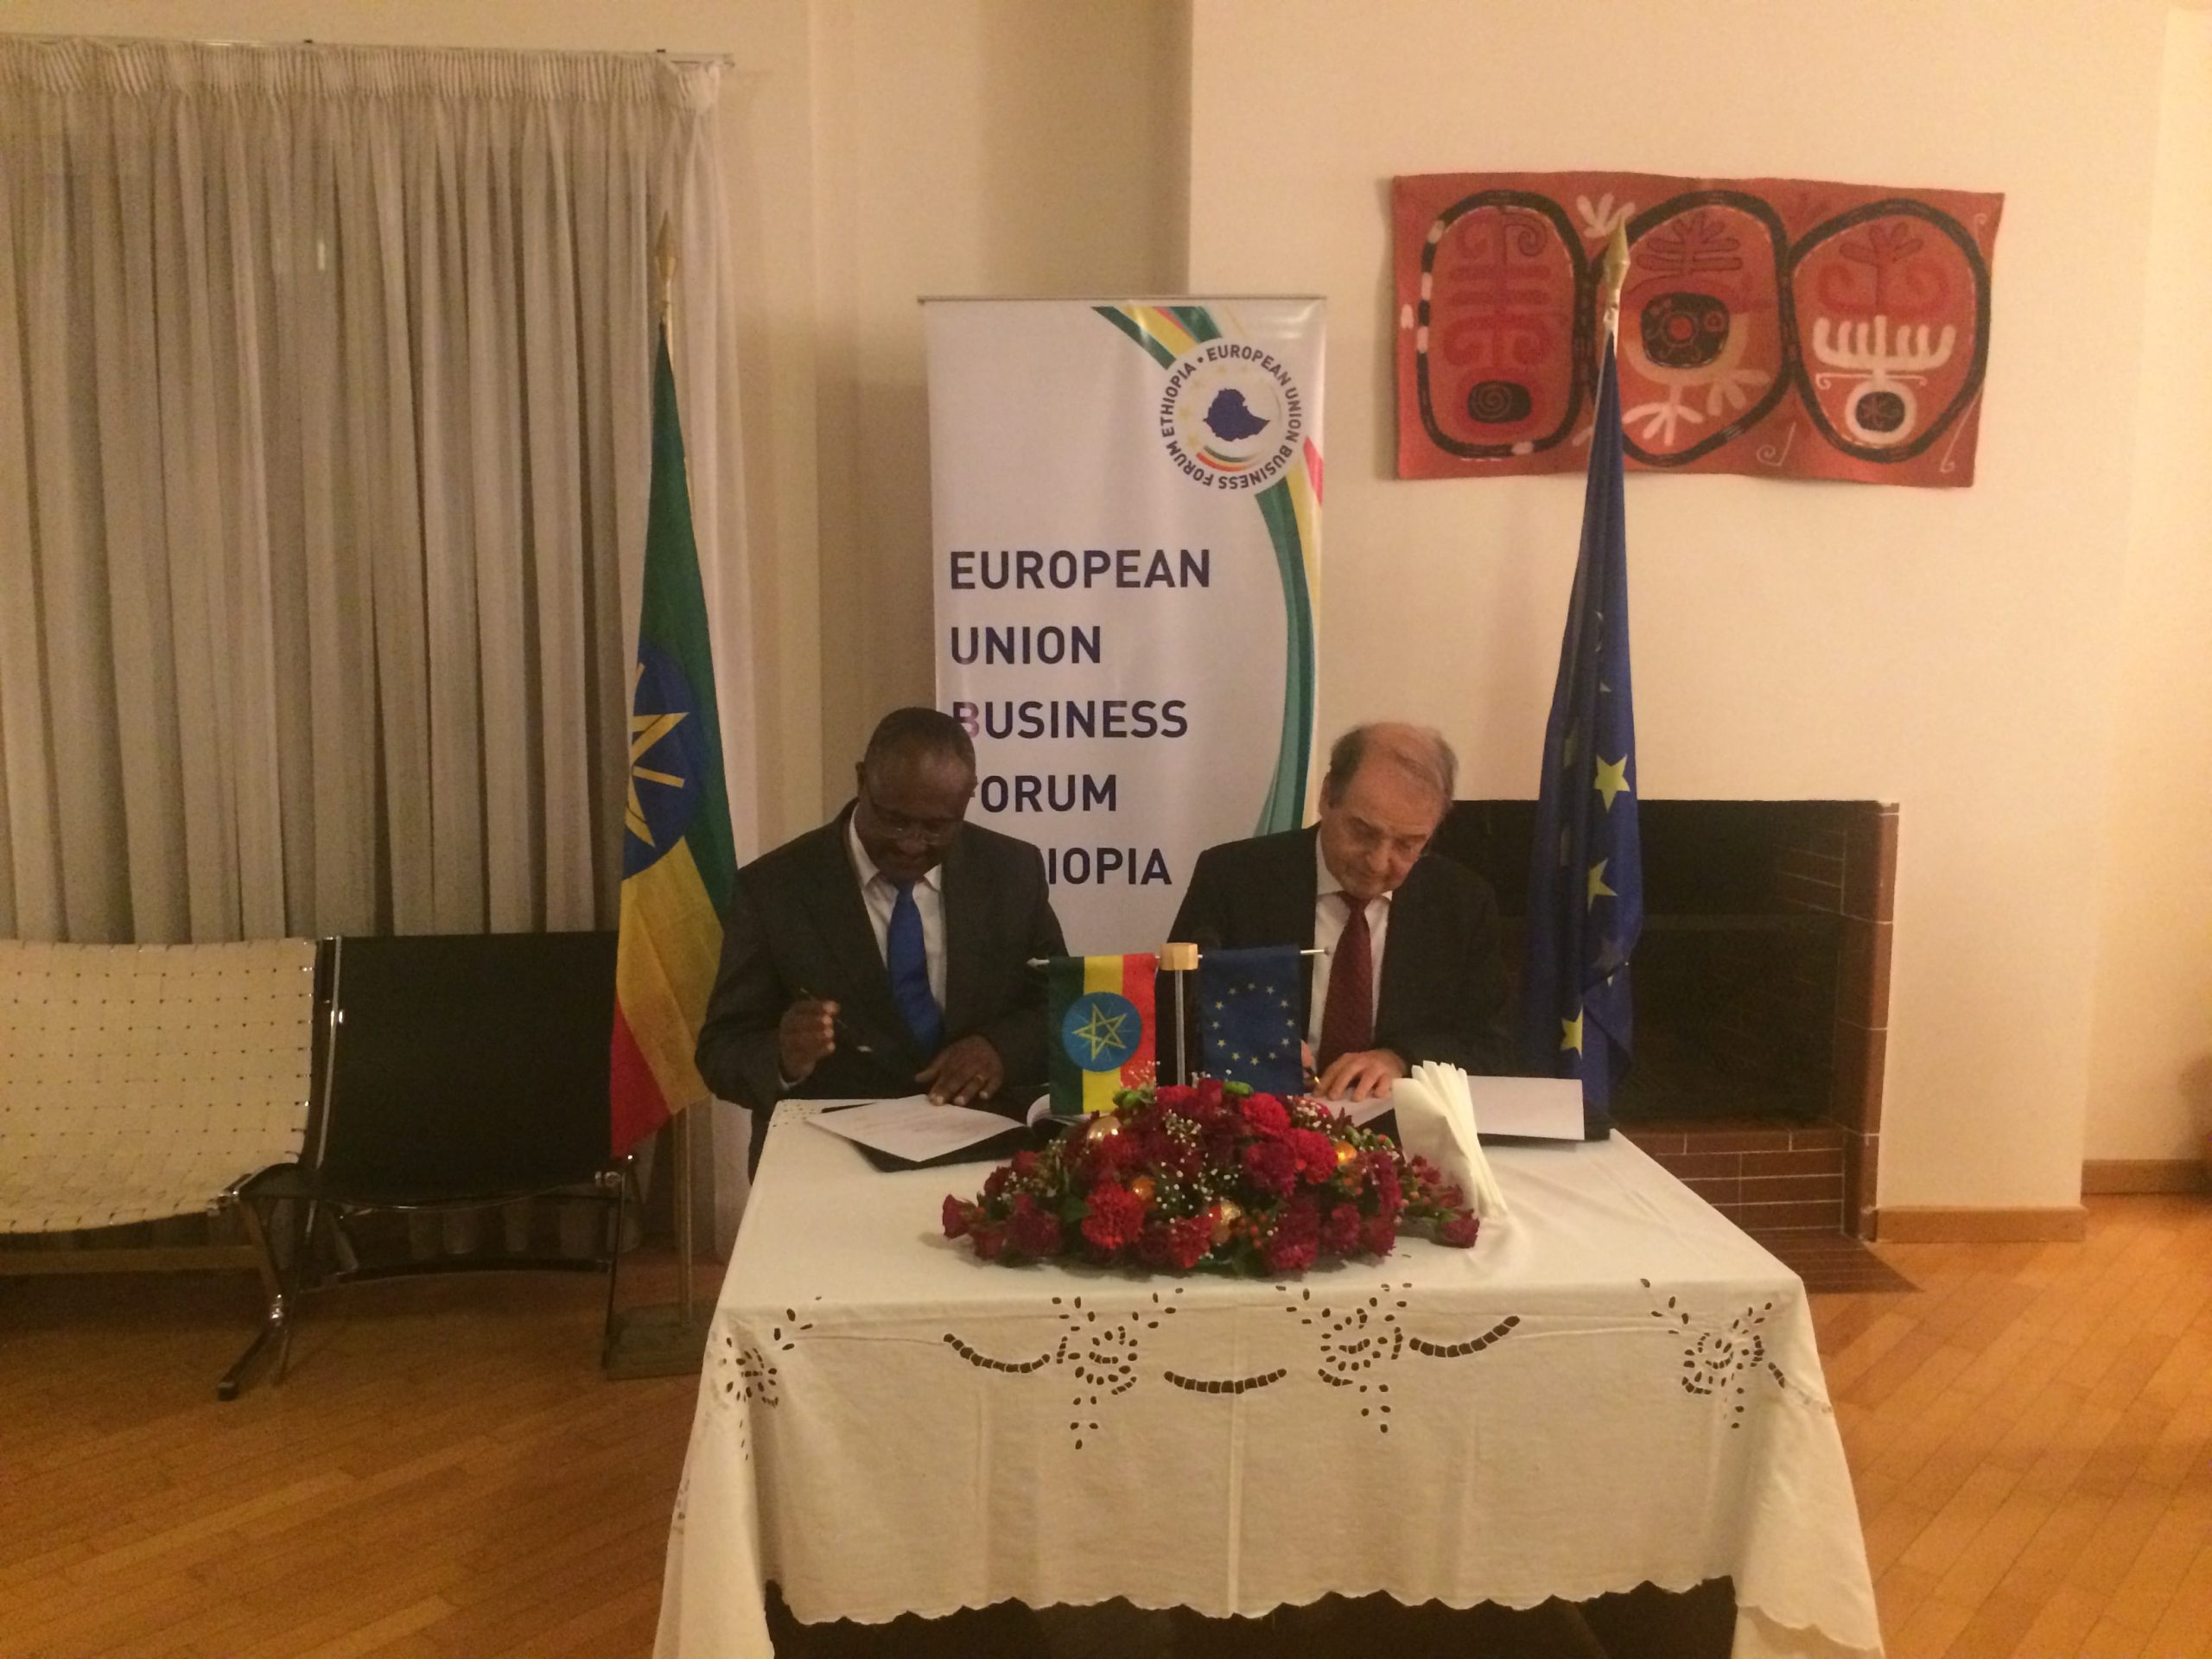
Intellectual Property rights protection in Ethiopia
On September 6th, 2017, the EUBFE together with Mehrteab Leul & Associates Law Office, held a session on the protection of Intellectual Property rights under Ethiopian law. Discussions centered on trademarks registration and protection.
EUBFE 4th Year Anniversary
On June 28th, 2016, the EUBFE celebrated its 4th Year Anniversary. This event was also the the opportunity for the EUBFE to sign a Cooperation Agreement with the Ethiopian Investment Commission, represented by H.E Commissioner Fitsum Arega, a first step towards full recognition by the Government of Ethiopia.
Ethiopia Economic and Trade Report 2015
Labelled as one the “African lion” economy, Ethiopia has recently been getting much attention from international investors and observers, appealed by its impressive decade growth, its stability and its large domestic market. In this context, was fiscal year (FY) 2014/2015 a good year for Ethiopia? And more importantly, is Ethiopia on the track to reach its main goal, to become a lower middle-income country by 2025?
CONTEXT
The year 2015 witnessed important downturns which affected the economies of the Sub-Saharan Africa (SSA). Overall growth in the region is projected at 3.75% in 2015, down from 5% in 2014, on account of less favourable conditions on commodity markets and more stringent global financial conditions.
In this context, Ethiopia is one of the few countries in the region where the combined recent trends did not have as much of a negative impact. Growth seemed to be holding up notably due to (i) continue investment in infrastructure, engaged under better financial market conditions; (ii) relatively strong private consumption; and (iii) historically low oil prices coupled with less unfavourable market price movements for its main commodities.
The GoE approved in December 2015 its second Growth and Transformation Plan (GTP II) which covers the 2015/2016 – 2019/2020 period. The main features of GTP II are articulated around the primary objective for Ethiopia to become a lower middle income country by 2025. This objective entails an annual average real GDP growth rate of 11% (with 8%, 20% and 10% growth for the agriculture, industry and services sectors respectively) with a high priority given to the export sector through (i) diversification; (ii) increased supply of high value crops, horticulture and manufactured goods; (iii) a stable exchange rate; and (iv) stronger banking and finance institutions.
MACROENOMIC SITUATION
GDP Growth
The Ethiopian economy pursued its decade old growth pattern with a real GDP growth of 10.2% registered in FY 2014/15 (compared with 11.2% projected in GTP I) still largely above the SSA region’s 4.4% average for that period.
The share of each sector in GDP continued to confirm the shift from agriculture (38.8%), towards industry (15.2%) while the services stagnated this year (46.6%). The corresponding absolute growth per sector came out for FY 2014/15 at 6.4% for the agriculture sector (a moderate increase from 5.4% last year linked with productivity gains and an improved Productive Safety Net Programme), 10.2% for services (a substantial decrease from 13% last year on account of reduced activity in the largely dominating whole sale and retail sector) and 21.6% for industry (a sizable increase but still essentially attributed to the construction sector which registered a 36.8% growth while manufacturing failed to pick up speed and growth remained around 16% for the third consecutive year).
The FY 2015/16 GDP growth of 11% forecasts by the GoE continues to look overoptimistic given constraints such as (i) limited growth of key trading partners (especially among emerging markets); (ii) underperforming export sector and uncertainty over the capacity of the private sector to respond to the GoE’s call for more involvement (in a context of limited credit/forex availability and an overall unfavourable business climate); (iii) lack of reliable statistical data; and (iv) consequences of the recent failed rainy seasons.
Inflation
Ethiopia’s year-on-year annual inflation pursued its upward trend all through 2015 and reached its peak in September 2015 with an overall inflation rate of 11.9% up from 5.8% a year before. Overall inflation eventually stabilized around 10% in December with 12.1% for food inflation and 7.7% for non-food inflation.
Monetary Policy
For FY 2014/15, Ethiopia’s monetary policy continued to be geared towards keeping inflation rate in single digits and maintaining control on exchange rates.
Ethiopia maintained a regime of managed-floating exchange rate as the National Bank of Ethiopia (NBE) pursued its policy of gradual depreciation. The nominal exchange rate reached 20.09 against USD in FY 2014/15 representing an annual depreciation of 5.4%. At the same time the Real Effective Exchange Rate continued to appreciate (21% year on year according to the IMF), since the USD appreciated again most currencies in 2015. This lack of competitiveness of the exchange rate remains a concern for the economy as it does not help improving export competitiveness in a context of export falling and deflationary trends on the trading partner’s side.
External sector
Based on NBE data, the external sector displayed a 29.1% deterioration in the trade balance in FY 2014/15 still on account of increased imports for infrastructure and developmental projects coupled with export underperformance.
The concentration of export earnings remained important with coffee, oilseeds and gold representing 53% of all export earnings.
The availability of forex has been problematic all through 2015 for the private sector, as most reserves continued to be directed to finance imports of intermediate and capital goods for public investments (resources were also used to import food to drought affected areas). Private operators regularly complained over long delays for opening Letters of Credit for access to forex.
DEVELOPMENTS IN THE REAL SECTORS
Agriculture
In FY 2014/15, overall agricultural production of cereals increased by 45% while yield/ha grew by 22%. However, crop yields in Ethiopia are still lingering at 55% of the world average.
The transition of subsistence oriented smallholder farmers into more market oriented production intensified although much remains to be done. Large-scale value addition and agro-industrialization have also been largely promoted by the GoE.
Due to the negative effects of El Niño, resulting in rainfall irregularities, the rural population requiring humanitarian assistance in 2016 reached 10.2 million people, showing the precarious nature of Ethiopia’s smallholder agriculture.
Industry
Industrial Parks (IPs) are a prominent strategy of GTP II to overcome current bottlenecks and boost private investments. The planned job creation is targeted at 200,000 per year but reaching this target will entail overcoming the major challenge of the lack of high skill employees required to increase the employment share of the manufacturing sector.
The GoE established a dedicated Industrial Parks Development Corporation (IPDC) to promote and drive this strategy’s implementation. IPDC prepared a national master plan aimed at the development of a total of 10 IPs (under domestic/foreign public investment funding worth 5 billion USD) which should become operational between 2016 and 2017.
Roads
The GoE has confirmed in the GTP II its very ambitious objectives for the road sector (to double the current road network of 100.000 km in 5 years, reaching 200.000 km by 2020). One of the most important projects finalized in the road sector in 2015 was the new expressway extension project linking the expressway Addis Ababa – Adama to Modjo and Hawassa, for a total of 203km.
Railway
The Addis Ababa’s light railway was inaugurated in September 2015. The urban railway project was funded by China’s Exim Bank (for a total amount of 475 million USD) and should contribute to solve the city’s growing road transport problems.
Construction of the new electrified railway between Addis Ababa and Djibouti has not yet been completed but freight service was launched to enable the delivery of large quantities of wheat to areas affected by drought.
Energy
In December 2015, the GoE announced that the GERD was 55% complete and the diversion of the Blue Nile will begin.
In September 2015 Ethiopia and Djibouti signed an agreement for the construction of a 550 kilometre line to transport diesel, gasoline and jet fuel from Djibouti to Awash.
In July 2015, the Ethiopian Electric Power and the Reykjavik Geothermal company signed a Power Purchase Agreement for the first 500 MW of the Corbetti geothermal project, which was announced as a possible 1,000 MW project. Upon completion, it would be Africa’s largest geothermal facility and likely the world largest.
Transport / Logistics
Ethiopian Airlines (EAL) performed remarkably in 2015, registering a profit of ETB 3.5 billion. EAL also continued to expand its fleet and opened 8 new international routes, confirming Addis Ababa’s position as a hub for air transport in Africa.
The Ethiopian Shipping & Logistics Services Enterprise reached an agreement with ERCA to deliver shipments directly to the warehouses of large quantity importers who import full containers. This revived multimodal approach should reduce the cargo congestion at dry ports but remains subject to challenges such as low quality of services and poor handling of goods.
Telecommunications
Ethiopia ranked poorly (130th out of 143 states) in the Global Information Technology report 2015. Increased competition in the sector should remain an important objective for the GoE.
Tourism
Ethiopia was selected as 2015 top destination in the world for tourists by the European Council on Tourism and Trade. Tourism in Ethiopia generates around USD 3 billion of revenues yearly and employs around 1 million people. With GTP II, the GoE made the bold announcement that it intends to triple foreign visitors to more than 2.5 million by 2020, which, if achieved, will boost foreign exchange reserves.
INVESTMENT AND BUSINESS CLIMATE
Based on the latest Ernst & Young’s Africa attractiveness report 2015, Africa became the world’s second largest FDI destination in 2014 with USD 128 billion capital investment and Ethiopia registered an 88.2% increase in FDI projects, emerging as the 8th largest recipient of FDI projects in Africa. However, this trends need to be confirmed in 2015 and 2016. Poor performance in the 2016 Doing Business and Global Competitiveness Index might negatively impact investors’ interest.
Overall, the major trends in Ethiopia’s economy remain “largely favourable” as qualified by the IMF in its latest Article IV review, with (i) sustained growth (for more than a decade now); (ii) single digit inflation; (iii) tight monetary policy and prudent fiscal management; (iv) increasing FDIs and remittances; (v) rising domestic savings and capital formation; (vi) continued high levels of public investments in infrastructure; and (vii) a new industrial policy geared towards diversification and transformation of the economy.
Yet, downsides are still present and new ones are surfacing which may jeopardize the 2025 vision expressed by the GoE, such as (i) an over ambitious national planning based on unclear financing capacity and overoptimistic forecasts; (ii) the disappointing results of the manufacturing sector with a corresponding insufficient export revenue generation; (iii) strong impediments still limiting the development of the private sector; (iv) increasing shortage of foreign currency hampering economic activity; (v) limited access to financing for local private investment; (vi) an increasingly overvalued exchange rate impacting competitiveness of exports; (vii) a plunging current deficit and an increasing public debt (notably contracted by state owned enterprises); and (viii) a concentrated financial market still largely dominated by CBE.
Comprehensive immigration directives for foreign investors
Technical Committee
